Date: Thu Oct 22 2009 - 08:56:54 PDT
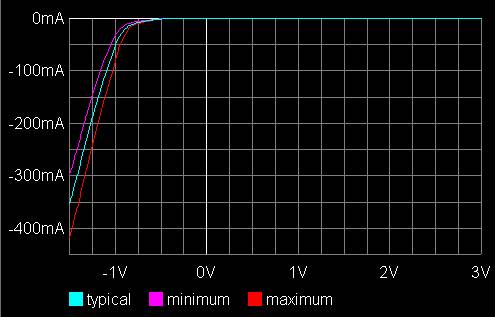
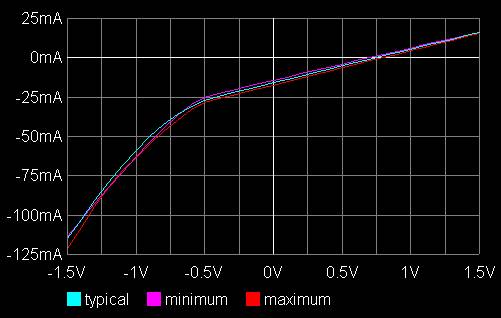
Hi all.

I have some conceptual issue.

The next graph represents gnd clamp of an input model of a memory with 120
ohm ODT

This is model of a famous company which I download:


I don't understand how it is possible that the current is zero fot V> -0.5V.

The meaning of ODT is resistor that connected from the input to the gnd.

So for this range (when V>-0.5V) I was expecting to see linear current with
a slope that equal to the resistor.


For example when I simulated gnd clamp of an input buffer with 50 ohm ODT I
received the next plot:


You can see that the plot is liner for V> -0.5V as expected.

I looked in a lot of ibis file and I never saw common behavior.

So I guess that maybe I am doing something wrong.


I will be glad to hear your comments.


Thanks a lot.


Kobi.


--
This message has been scanned for viruses and
dangerous content by MailScanner, and is
believed to be clean.


--------------------------------------------------------------------
|For help or to subscribe/unsubscribe, e-mail majordomo@eda-stds.org
|with the appropriate command message(s) in the body:
|
|  help
|  subscribe   ibis       <optional e-mail address, if different>
|  subscribe   ibis-users <optional e-mail address, if different>
|  unsubscribe ibis       <optional e-mail address, if different>
|  unsubscribe ibis-users <optional e-mail address, if different>
|
|or e-mail a request to ibis-request@eda-stds.org.
|
|IBIS reflector archives exist under:
|
|  http://www.eda-stds.org/pub/ibis/email_archive/ Recent
|  http://www.eda-stds.org/pub/ibis/users_archive/ Recent
|  http://www.eda-stds.org/pub/ibis/email/         E-mail since 1993