Date: Wed Aug 28 2013 - 09:12:54 PDT
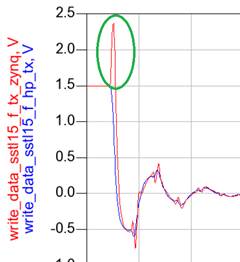
Shravanthi,

I am not sure how to answer your question because I don't
understand what you mean by "unequal data".  Please explain
what you mean by that.

Regarding what you call "overshoot", first you have to
understand what that is caused by in the real device.

Consider a pulldown transistor as the output driver, connected
to GND.  In this configuration it works as an inverter, meaning
that its controlling gate voltage has to go up when the output
voltage goes down.  But the channel of the transistor will only
turn on after the gate voltage goes past the Vth (threshold
voltage).  Before that the channel is pretty much turned off,
or it is in a high impedance state.  During this time, the
upwards moving gate voltage is coupled to the output through
the parasitic capacitances inside the transistor.  So before
the output voltage starts coming down, it goes up a little bit
due to the waveform on its gate coupling to the output.  This
is a real effect and you should not eliminate it from the IBIS
model's waveforms.

To answer your question on how these waveforms are used in the
tools, you might want to look at pg. 4-9 in this presentation:

http://www.eda.org/ibis/summits/jun03b/muranyi1.pdf

This explains how the V-t tables (waveforms) are converted to
a scaling coefficient to scale the I-V curves with respect to
time as the buffer is switching high to low or low to high.

I hope this answers most of your questions...

Thanks,

Arpad
=================================================================

From: owner-ibis-users@eda.org [mailto:owner-ibis-users@eda.org] On Behalf Of Shravanthi Ippagunta
Sent: Wednesday, August 28, 2013 7:59 AM
To: ibis-users@eda.org
Subject: [IBIS-Users] Simulator interpretation of ibis data

Hi,

I would like to understand how the two tables for Rising/Falling waveforms(RW/FW)  (Terminated to GND and Terminated to VCCO/VTT) in an ibis file are interpreted by a simulator while plotting the output of an IO buffer (if the input is a pulse).

I am doing the ibis modeling here at Xilinx and there was a request to remove redundant data from the RW/FW to get a better "EYE". In the edit process, unequal data was removed from the two tables - FW to GND and FW to VTT - due to which, in my simulation, there was an overshoot/undershoot in the waveform (below is a snapshot). I would like to know how the unequal data edits translate into the bump seen.
[cid:image012.jpg@01CE9FEC.AD704F40]


Thanks,
Shravanthi


This email and any attachments are intended for the sole use of the named recipient(s) and contain(s) confidential information that may be proprietary, privileged or copyrighted under applicable law. If you are not the intended recipient, do not read, copy, or forward this email message or any attachments. Delete this email message and any attachments immediately.


--
This message has been scanned for viruses and
dangerous content by MailScanner<http://www.mailscanner.info/>, and is
believed to be clean.

--
This message has been scanned for viruses and
dangerous content by MailScanner, and is
believed to be clean.


--------------------------------------------------------------------
|For help or to subscribe/unsubscribe, e-mail mikelabonte@eda-stds.org
|or ibis-request@eda-stds.org
|
|IBIS reflector archives exist under:
|
|  http://www.eda-stds.org/ibis/email_archive/ Recent
|  http://www.eda-stds.org/ibis/users_archive/ Recent
|  http://www.eda-stds.org/ibis/email/         E-mail since 1993